
In Brussels, apartment prices can vary sharply from one municipality to another. In some municipalities, the average exceeds €400,000, while in others it is just above €210,000.
In a previous article, we looked at access to public housing in Brussels and the savings it can offer. However, not all families are eligible to live in public housing, while others choose not to pursue it because of long waiting times or administrative burdens.
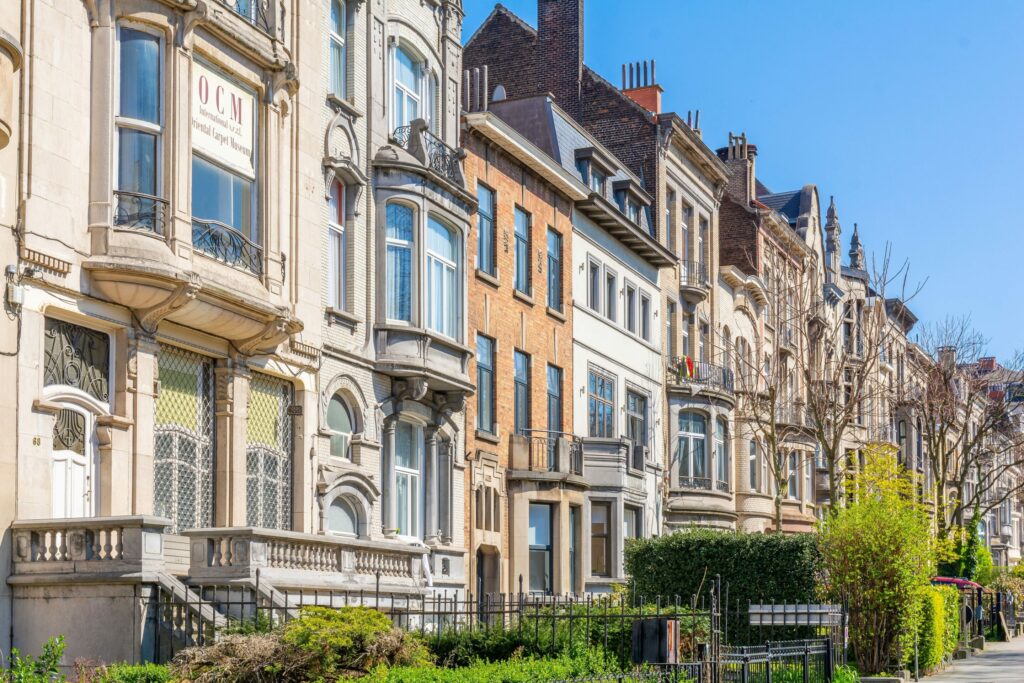
This is why many households looking to buy turn to the private market, where prices vary dramatically.
In this article, the focus is on apartments rather than houses. This reflects the structure of the Brussels property market: as in many other dense urban areas, apartments account for most residential property sales.
In 2025, according to the Notaries’ Barometer, apartments represented 70.3% of residential property sales in the Brussels-Capital Region, compared with 29.7% for houses.
By contrast, in Flemish Brabant, apartments represented only 26.3% of residential property sales, while houses accounted for 73.7%.
Why prices differ
A Brussels Studies report notes that housing prices provide insight into territorial dynamics because they reflect the “relative attractiveness” of different areas.
In other words, prices are shaped not only by the property itself, but also by the wider appeal of its location — including factors such as transport links, housing quality, green space and the broader living environment.
Energy performance can also affect prices, especially when comparing older apartments with newer or recently renovated ones. In general, higher prices therefore tend to reflect stronger demand for certain locations, although they are also shaped by the type and quality of housing available.
Municipality-level figures can hide very different local realities. This is why neighbourhood-level indicators, such as those provided by IBSA’s Monitoring des Quartiers, are particularly useful in large and socio-economically diverse municipalities such as the City of Brussels, with areas as different as the city centre, Laeken, Haren and Neder-Over-Heembeek.
Where prices are the highest
Some sources use average prices, while others use median prices, which are less affected by very expensive sales. The figures below should therefore be read as broad indicators rather than a definitive ranking.
Looking at the latest average prices shown on notaire.be’s real-estate price map, Woluwe-Saint-Pierre tops the list, average apartment costing just above €400,000. It is followed by Ixelles, Uccle, Woluwe-Saint-Lambert and Watermael-Boitsfort, where average prices range roughly between €340,000 and €380,000.
This ranking broadly corresponds to socio-economic and spatial indicators. Statbel places Woluwe-Saint-Pierre, Woluwe-Saint-Lambert, Uccle and Watermael-Boitsfort among the Brussels municipalities with the highest median disposable incomes.
Density figures also show that several of these higher-priced municipalities — notably Watermael-Boitsfort, Uccle and Woluwe-Saint-Pierre — are among the least densely populated in the region.
Where apartments are more affordable
The least expensive municipalities are mostly located in the west and north-west of Brussels. Anderlecht, Molenbeek, Koekelberg, Jette and Ganshoren are among the most affordable municipalities, with average prices ranging from around €210,000 to €230,000.
More “affordable” does not mean “cheap”. Even Brussels’ least expensive municipalities remain more expensive than, for example, cities in Hainaut with direct train connections to Brussels, such as Tournai and Mons, where average apartment prices are around €193,000 and €179,000 respectively.
Yet median disposable incomes in Tournai and Mons are higher than in all five Brussels municipalities listed above, meaning that housing is more affordable there when measured against local incomes.
Trends
The Notaries’ Barometer points to a more active property market in Brussels over the past five years, even though the increase in sales was smaller in 2025 than in Belgium as a whole. In the Brussels-Capital Region, the number of sale deeds rose by 13.2% over five years, compared with 11% nationally. Over one year, however, Brussels recorded a smaller increase of 7.1%, below the national rise of 14.2%.
However, apartment prices did not rise at the same pace as inflation: the average apartment price in Brussels rose by 10.33% over five years, while inflation reached 23.5% over the same period.
The buyer profile also shows the importance of younger age groups in the Brussels apartment market. Apartment buyers in Brussels are relatively concentrated in younger age groups, with the 26–30 and 31–35 age brackets representing the largest shares in the region.
Another structural trend is the shrinking share of new-build apartments, which are generally more expensive: Their share fell from 20.2% in 2021 to 10.1% in 2025.
Ultimately, the Brussels apartment market reflects the city’s wider geography: dense, unequal and highly localised. Prices remain highest in much of the south and east of the capital and lower in parts of the west and north-west. But averages can hide major differences between neighbourhoods, building types, surface areas and energy performance.
For buyers, the key lesson is to look beyond the name of the municipality. In Brussels, two apartments just a few streets apart can belong to very different markets.