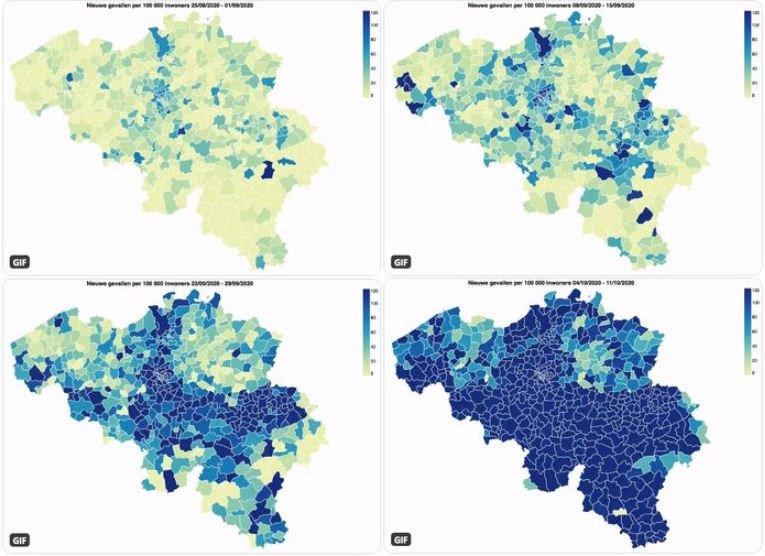
A map of Belgium posted on Twitter by Bart Mesuere, a researcher at the University of Ghent, visualises how the coronavirus spread across the country in a month and a half.
On Sunday, Mesuere posted several detailed graphs and a map showing how the coronavirus epidemic is evolving in Belgium, across all provinces and age groups.
"Meanwhile, all provinces are above the highest ECDC (European Centre for Disease Prevention and Control) threshold of 120 infections per 100,000 inhabitants in the last fortnight. The province of Antwerp has seen a clear increase in the last few days," he said.
"There was a confirmed infection in virtually all municipalities last week," Mesuere said. On a map, he shows how the virus swept over the country in about six weeks time.
In virtueel alle gemeenten was er afgelopen week een bevestigde besmetting. Vlaanderen ziet er iets beter uit, maar komt niet zo heel ver achter op Wallonië en Brussel. 7/8 pic.twitter.com/x5HtgMhRpH
— Bart Mesuere (@BartMesuere) October 11, 2020
The map shows the number of new cases per 100,000 inhabitants per municipality. While in the first week - from 25 August to 1 September - the map is stilled colour mostly light green (between 0 and 20 cases per 100,000 inhabitants), it rapidly turns dark blue (over 120/100,000) by the period from 4 to 11 October.
"Flanders looks a little better, but is not that far behind Wallonia and Brussels," he said. "Hopefully, next week we will see the first signs of a slowdown, because things are not looking so good."
The number of tests carried out in Belgium remained constant, with a slight increase in recent days. "However, the proportion of positive tests continues to increase strongly," Mesuere said.
Related News
- Wallonia, Brussels, Flanders: Belgium's Covid-19 state of play
- Belgium: Second worst country in Europe for coronavirus infections
- Belgium can't rule out another lockdown, experts warn
While the positivity rate of the tests remained at 2-4% in September, it has now climbed to over 10%, meaning that about one in ten people who take a Covid-19 test, get a positive result, according to Sciensano's figures.
The average number of new infections has been increasing at a rate of around 12% per day over the last few days, according to Mesuere, without "a delay or plateau in sight for the time being."
On Monday morning, health officials confirmed Mesuere's math, saying that the number of new infections is currently doubling every eight days. If the current trend continues, Belgium could even record over 10,000 new infections per day by the end of the week.
Maïthé Chini
The Brussels Times

