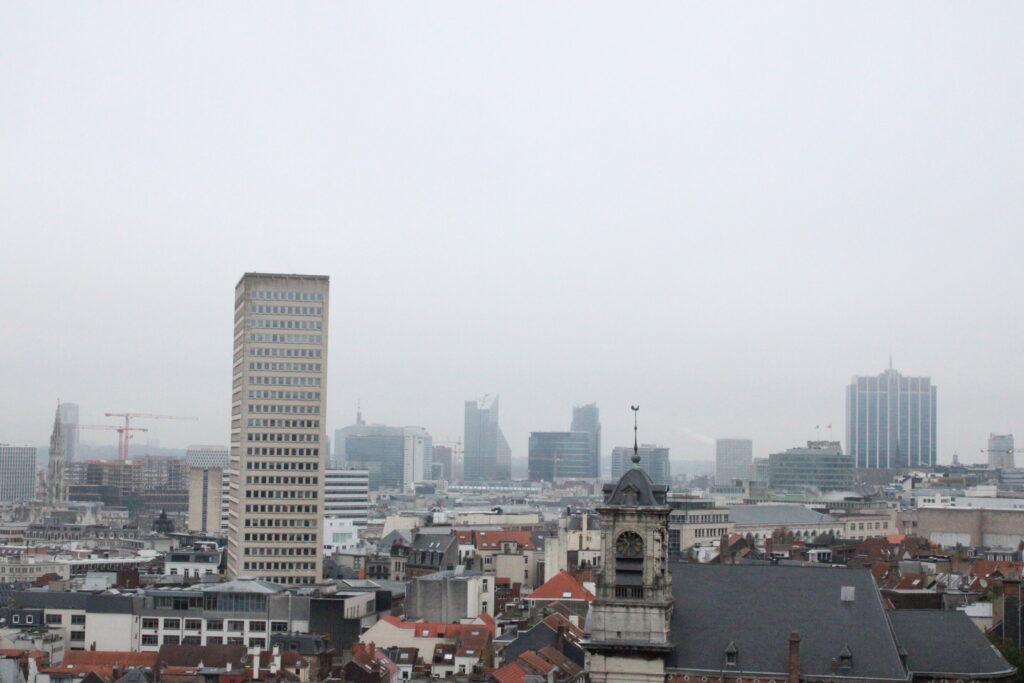
From a business perspective, Brussels continues to perform well due to the concentration of economic and public sectors in the region. However, when it comes to this wealth translating into higher household income, Brussels fares among the worst in wealthy capital cities.
The OECD's 2024 edition of Regions and Cities showed that economic growth in the Brussels-Capital Region was -0.5%, based on real gross domestic product (GDP) per capita. This is much lower than in Flanders (1.46%) and Wallonia (0.23%).
"But at the same time, the Belgian capital has the highest labour productivity of the whole country," OECD Economist Cem Özgüzel told The Brussels Times. This measure compares economic output against the amount of labour required to produce that output.
Moreover, Brussels is among the best-performing regions of the OECD in terms of labour productivity, measured in gross value added (GVA). "It is now ranked in the top 3% of the OECD regions."
Stark imbalance
Brussels is no anomaly: all capital city regions in the OECD show higher levels of GDP per capita and higher labour productivity. "This is especially the case in smaller countries, where economic activity tends to be concentrated in capital city regions."
The presence of international organisations in Brussels also plays a key role: much of the productivity is concentrated in the public sector with high knowledge-intensive sectors, highlighting the influence of international foreign activity.
Yet, there is a stark imbalance between labour productivity and GDP per capita – two measures that represent the well-being of companies in the region – and how residents are faring, which is reflected in disposable household income. The GDP per capita is more than three times higher than the disposable income in Brussels.
"This shows that having a high GDP per capita does not necessarily translate into having a very high household income," said Özgüzel. It also highlights that much of this GDP generated in Brussels doesn't necessarily stay in the region in terms of income. "These discrepancies are seen in all capital city regions in the OECD, but Brussels is one of the capital city regions that has the highest ratio between the two."
This is reflected in the level of disposable income inequality when comparing the incomes of the richest and poorest people in Brussels. "The region is the most unequal in terms of interpersonal inequality in Belgium," OECD Economist Marcos Díaz Ramírez told The Brussels Times. "It has the highest interpersonal inequality ratio in Belgium."
Again, this is in line with other OECD capital cities. "They tend to be the engines of growth of countries, which means they attract people and workers of all profiles," said Díaz Ramírez. "This also generates inequality." The OECD is therefore calling on cities to work on promoting growth more inclusively.
Housing issues
The OECD report also touched on how cities are navigating the housing crisis. Housing in Brussels has become increasingly unaffordable in recent years. Rental contracts stood at an average of €1,249 per month in 2023 – almost €100/month more than in 2022. Meanwhile, the price of an average house in the region has increased from €465,000 in 2019 to almost €555,000. Various factors are also putting pressure on sectors working to increase housing supply.
Díaz Ramírez noted that the trend of rising prices is observed in all countries, and that prices are rising faster in large cities. "The larger the city, the higher the increase. Again, Belgium is no exception." However, when comparing property prices in the largest and smallest cities, the gap in Belgium is not significant. In South Korea or Hungary, for example, the gap between the two is above 100%.
"Overall, we have noted that investment in housing has not been in line with demand, which is contributing to the cost of living crisis, as housing costs are depleting many household incomes."

